Protein Requirements of Bison Bulls Fed for Meat
Abstract
Bison bull calves (n=80, initial avg. wt 633 lb ± 5.37) were randomly allocated to four different (9.4%, 11.6%, 13.9% and 16.0%) crude protein (CP) diets and fed from January until September 2001, in a 75 percent concentrate corn-based diet using increasing levels of canola meal as the protein source. Feed intake was not affected by protein level but average daily gains improved with increasing protein levels in the diet. The 13.9 percent CP diets produced the fastest (P<.05) gain during the first three months on feed and overall. Lowest gains were from the 9.4 percent and 11.6 percent diets with the 16.0 percent CP diet being intermediate. Feed efficiency was not affected by varying protein levels. Fecal nitrogen was numerically greater in the 16 percent CP diet and similar in the 9.4 percent and 13.9 percent CP diets. Feed cost per pound of gain increased with escalating protein level, requiring increased gain to compensate for added feed cost. Bison producers interested in maximizing gain are recommended to feed 13.9 percent protein to growing bulls according to data from this study.
Key words: bison, crude protein, nutrient requirements.
Introduction
Optimum requirements for several different nutrients for bison have not been determined. Protein is a major issue in bison diets as it is usually the most expensive nutrient after minerals. With increasing numbers of animals being raised and more careful management provided, there is an increasing need for information on the nutrient requirements of bison. There is little opportunity or interest in altering the diet of grazing bison as bison have evolved over hundreds of years, prospering and multiplying in a sometimes harsh environment. There is some interest in supplementing the grazing diet during breeding season, in cases of known mineral deficiency, or where extra energy is required due to limited forage or other circumstances.
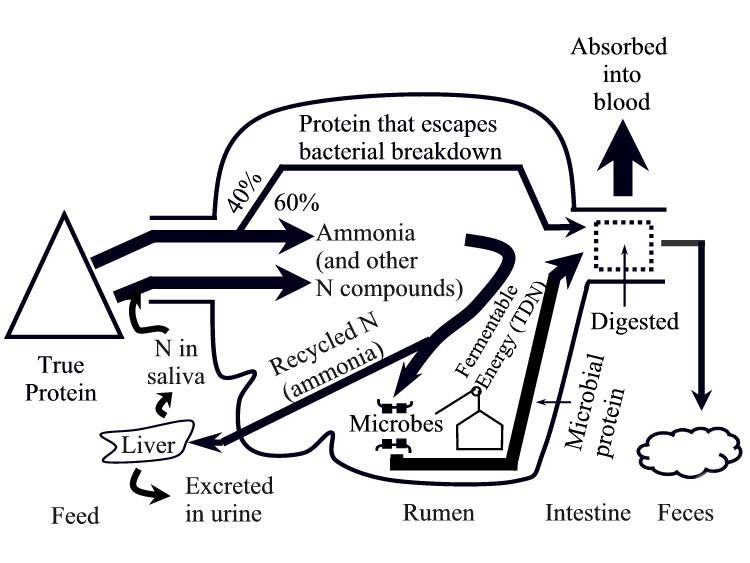
Supplemental feeding is being practiced in some herds during severe inclement weather and to facilitate optimum growth of animals destined for meat. Producers are concerned about the metabolic and economic liability of providing too little or too much crude protein. There is some evidence that bison require lower levels of protein than other grass-based ruminants (bovine) due to metabolic recycling mechanisms for nitrogen (Figure 1). Some studies with grazing bison have been conducted to investigate nitrogen recycling. Peden (1972) and Peden et al. (1976) indicate that a negative nitrogen balance occurs at a lower dietary protein level with bison than cattle suggesting bison have lower requirements for protein. There is evidence of increased blood urea nitrogen levels with increasing protein in the diet (6% vs. 15%, Keith, 1977), suggesting excess levels of protein are recycled, and eventually excreted. However, other evidence suggests recycling can occur at lower protein levels (4%, 5%, and 6% crude protein) as elevated ruminal nitrogen levels were observed from the 4 percent and 5 percent diets over the 6 percent diet (DeLiberto, 1985).
It is apparent that bison can adapt and survive at lower protein levels. Protein required by bison cows to maintain body weight and reproduce may be variable depending on adaptation, age of animal, forage type, or other factors. The question remains as to what performance level is achievable at higher levels for cows and for bison fed for meat. Bison fed for meat receive supplemental feed, which is considered by some to be an important management step to produce uniform, palatable, high quality bison meat products. This experiment was conducted to compare animal performance and cost of gain from four different protein levels in the diets of bison bulls fed for meat.
Figure 1. Nitrogen metabolism in bison
Experimental procedure
In January 2001, 80 bison bull calves (avg. wt. 633 lb ± 5.37) were allotted by gate cut to eight pens (10 head per pen) and fed 75 percent concentrate diets with four different protein levels. The crude protein levels were 9.4, 11.6, 13.9 and 16.0 percent. The 60 percent corn grain diets included varying levels of canola meal as the protein supplement along with corn silage, prairie hay, and a standard bison mineral supplement. Diets were fed once daily as total mixed rations in fence line bunks. Animals were weighed at the start of the trial and at approximately 90-day intervals thereafter. Carcass traits were measured for all animals after slaughter and compared by treatment. Manure samples were collected at weigh period intervals to compare fecal nitrogen excretion. Treatment comparisons were made for dry matter intake, average daily gain, feed efficiency, feed cost per unit gain, carcass quality traits, and carcass value.
All animals involved in this study were treated humanely and handled in accordance with management practices as described in guidelines published by the Institutional Animal Care and Use Committee as prescribed by federal regulations. Facilities used to process bison were purchased with funds from a USDA-NRI Equipment Grant-No. 9703466.
Results
Dry matter intake (Table 1) was not significantly different (P>.10) among treatment groups for the spring (January – April) or summer (April-September) feeding periods. Dry matter intake averaged 13.62 pounds per day during the spring or approximately 2.15 percent of starting body weight. During the summer, bison consumed 19.81 pounds of dry matter daily or approximately 2.49 percent based on initial weight in April.
Protein level had a positive linear effect (P<.10) on gain (Table 1) during the spring with 13.9 percent CP diet producing the fastest gain (1.91 lb/d vs. 1.61 for 9.4%, and 1.64 for 11.6%; the 16% diet was intermediate at 1.83 lb/d). Summer gains were not affected by protein level (P>.10), however, over the entire feeding period, gains were greatest for the 13.9 percent diet (1.84 lb/d followed by the 16% at 1.75 lb/d, and the 11.6 and 9.45 percent protein diets produced 1.65 and 1.66 lb/d, respectively). Feed efficiency reported as gain per feed (Table 1) was not significantly different (P>.10) among protein treatments.
Table 1. Performance of bison bulls fed four levels of crude protein.
|
|
Dietary crude protein, DM basis |
|
|||
|
|
9.4% |
11.6% |
13.9% |
16.0% |
Std Err |
Initial wt, lb |
633 |
637 |
631 |
631 |
5.37 |
DM Intake, lb/hd/d |
|
|
|
|
|
Jan-Apr |
13.45 |
13.60 |
13.55 |
13.87 |
.13 |
Apr-Sep |
20.04 |
19.61 |
19.83 |
19.74 |
.40 |
Overall |
17.30 |
17.11 |
17.22 |
17.31 |
.28 |
|
Avg daily gain, lb/hd/d |
|
|
|
|
|
Jan-Apr, lb/day |
1.61a |
1.64 a |
1.91 b |
1.83 a b |
.09 |
Apr-Sep, lb/day |
1.71 |
1.65 |
1.78 |
1.67 |
.09 |
Overall, lb/day |
1.66 a |
1.65 a |
1.84 b |
1.75 a b |
.06 |
|
Gain per unit feed DM |
|
|
|
|
|
Jan-Apr |
.120 |
.121 |
.141 |
.132 |
.014 |
Apr-Sep |
.085 |
.084 |
.090 |
.085 |
.013 |
Overall |
.096 |
.096 |
.107 |
.100 |
.012 |
Carcass traits (Table 2) appear to be similar for all treatments (P>.10). Carcass value is based on No. 1 carcass price of $2.14 per pound with No. 2 returning $2.00 per pound. Quality grade is based on several factors including carcass weight, fat thickness (less is better), fat color (whiter is better), lean color (bright red is desirable) and maturity indicated by number of permanent teeth and bone ossification.
Table 2. Carcass data from bison bulls fed four levels of crude protein.
|
|
Dietary crude protein, DM basis |
|
|||
Item |
9.4% |
11.6% |
13.9% |
16.0% |
Std Err |
No. carc evaluated |
17 |
15 |
17 |
16 |
– |
Live weight, lb |
1026 |
1005 |
1016 |
991 |
52.23 |
Hot carcass wt, lb |
575 |
566 |
576 |
576 |
31.66 |
Dressing percent |
56.04 |
56.37 |
56.70 |
58.18 |
1.51 |
Fat thickness, cm |
7.70 |
7.40 |
9.53 |
7.50 |
3.08 |
|
Fat color |
1.00 |
1.00 |
1.00 |
1.00 |
0 |
Lean color |
1.12 |
1.20 |
1.18 |
1.63 |
.70 |
Permanent teeth |
1.77 |
2.00 |
1.88 |
1.63 |
.69 |
Ossification score |
1.00 |
1.07 |
1.00 |
1.00 |
.12 |
|
Quality grade |
1.06 |
1.07 |
1.24 |
1.15 |
.32 |
Carcass value, $ |
1225.35 |
1206.44 |
1212.51 |
1223.67 |
63.32 |
While fecal nitrogen (Table 3) was not significantly different (P>.10) among treatments, the highest numerical value of 2.28 percent nitrogen was observed from the 16 percent diet. The 11.6 percent diet was 2.01 percent nitrogen with the 9.4 percent and 13.9 percent diet very close at 1.81 percent and 1.82 percent nitrogen respectively. This observation supports the finding of the optimum protein level in this study as 13.9 percent. A nitrogen balance study that captures urine as well as feces should be conducted at some time when bison can be adapted to metabolism rates.
Table 3. Fecal nitrogen levels of bison bulls fed four levels of crude protein.
|
|
Dietary crude protein, DM basis |
|
|||
|
|
9.4% |
11.6% |
13.9% |
16.0% |
Std Err |
Kjeldahl Nitrogen, % Dry matter basis |
1.81 |
2.01 |
1.82 |
2.28 |
.26 |
Feed costs were lowest per pound of gain (Table 4) for the 9.4 percent diet at $.42 per pound followed by the 11.6 percent diet at $.44, the 13.9 percent diet at $.45 and highest for the 16 percent diet at $.51. Protein costs appear to be greater than any advantage in gain, especially for the 16 percent protein diet.
Table 4. Feed cost per pound of gain for bison bulls fed four levels of crude protein.
|
|
Dietary crude protein, DM basis |
|||
|
|
9.4% |
11.6% |
13.9% |
16.0% |
Jan-Apr, $ |
.36 |
.38 |
.36 |
.41 |
Apr-Sep, $ |
.46 |
.47 |
.52 |
.59 |
Overall, $ |
.42 |
.44 |
.45 |
.51 |
Discussion
Higher protein levels appear to support improved gain to a point, with 13.9 percent resulting in the fastest gains, but at a slight increase in cost per unit gain. Carcass traits were unaffected except for some improvement in dressing percent with higher protein levels. Carcass value was also higher for the two higher protein diets. Fecal nitrogen levels indicate 13.9 percent crude protein in the diet does not increase excreted nitrogen suggesting protein accretion and lean growth. Based on this study bison, producers feeding bulls for meat are recommended to feed higher levels of protein if it is available at competitive costs according to this experiment. Additional research may be justified at some future time to determine optimum levels of ruminally degradable and un-degradable crude protein.
Literature Cited
DeLiberto, T.J. 1985. Comparative digestive physiology of American Bison and Hereford cattle. Ph.D. Dissertation. Utah State University, Provo.
Keith, E. O. 1977. Urea metabolism of North American Bison. M.S. Thesis. Colorado State University Fort Collins.
Peden, D. G. 1972. The trophic relations of Bison bison to the shortgrass prairie. Ph.D. Dissertation Colorado State University Fort Collins.
Peden, D. G., G. M. Van Dyne, R. M. Hansen, and R. G. Rice. 1974. The trophic ecology of Bison bison L. to the shortgrass plains. J. Appl. Ecol. 11(3):489-498.